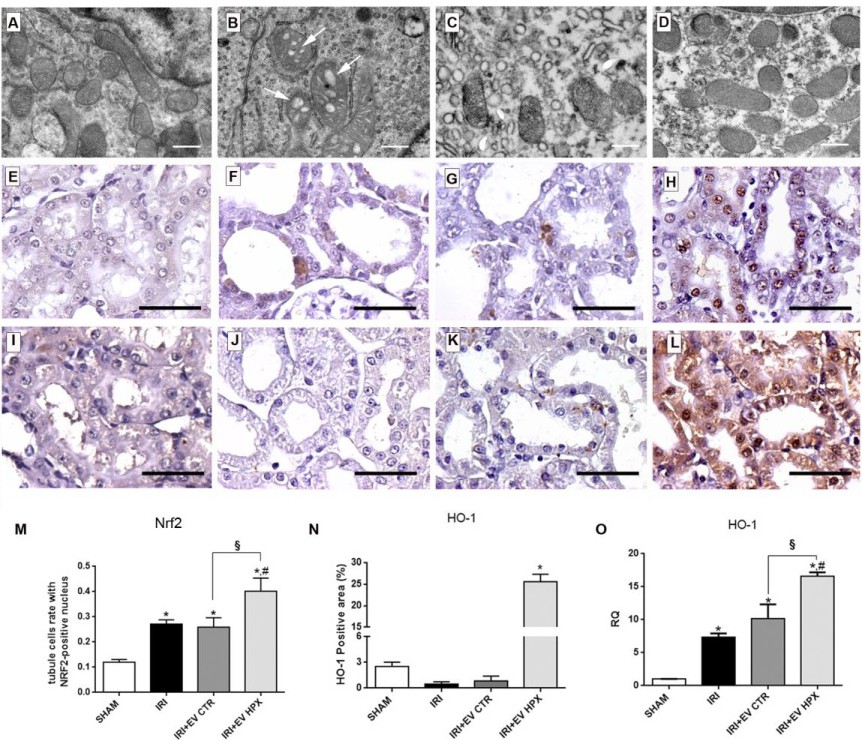
Fig. 6. Mitochondria protection and anti-oxidative stress response in renal cortex tissue modulated by EV CTR and EV HPX. Representative electron microscopy images of mitochondria in the cortical region of the kidney in the different groups: SHAM (A), IRI (B), IRI+EV CTR (C) and IRI+EV HPX (D), (white arrows indicate vacuoles structures, scale bars = 500 nm). Representative photomicrographs of the renal tissue slide immunohistochemistry for Nrf2 in all experimental conditions: SHAM (E), IRI (F), IRI+EV CTR (G), IRI+EV HPX (H), (scale bars = 50 µm). Representative photomicrographs of the renal tissue slide immunohistochemistry for HO-1 in all experimental conditions: SHAM (I), IRI (J), IRI+EV CTR (K), IRI+EV HPX (L), (scale bars = 50 µm). Quantification of the number of tubule cells with nuclear positivity for Nrf2 in relation to the total number of tubule cells/field from immunohistochemistry photomicrographs (n = 6) (M). Quantification of the percentage of area positively marked for HO-1 in each field from immunohistochemistry photomicrographs (n = 6) (N). mRNA levels of HO-1 in renal tissue, expressed as RQ in respect to the SHAM group (n = 5) (O). Data represent mean ± SEM. (* indicates statistical difference to SHAM group; # indicates statistical difference to IRI group, § indicates statistical difference to IRI+EV CTR group, P<0.05 assessed by one-way ANOVA followed by Tukey's test). Abbreviations: EV extracellular vesicles; SHAM, false operate; CTR, control; HPX, hypoxia; IRI, ischemia-reperfusion injury; NFR2, Nuclear factor (erythroid-derived 2)-like 2; HO-1, heme oxygenase 1; RQ, relative quantification.